Developing Conservation Tools
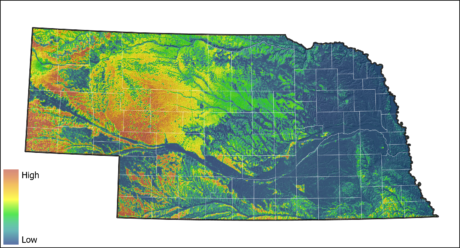
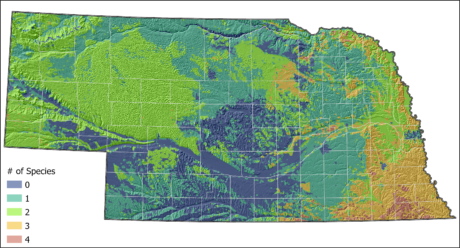
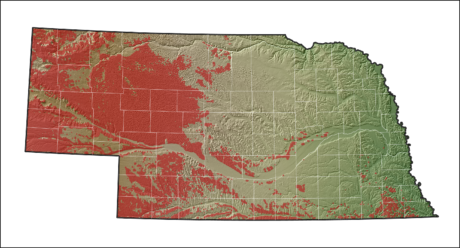
The RWBJV GIS office has been creating tools to help identify areas where conservation investment will have the largest impact. Using Breeding Bird Survey (BBS) data, we created statistical models to estimate relative abundance for our target species identified in the RWBJV Landbird Plan. These models can be used to produce ‘heat maps’ (Fig. 1)for each species, showing where they are most abundant.Using these datasets, a quantile assessment was completed to identify the smallest area where 50% of the population was estimated to be during the breeding season (Fig. 2). The core geographies for each priority species were then stacked to define grassland bird conservation areas where the core breeding ranges of multiple species overlap (Fig. 3). This allows us to focus our conservation efforts on areas where the greatest number of individuals of multiple priority species will be impacted, creating the best return on our efforts.
As a partnership, we recognize that we do not always work at the state-wide scale, and it is often important to focus our efforts at a smaller scale. Because of this, we tailored our tools to be able to be used at the state level, our Geographic Focus Areas (GFAs), or any other sub-geography that our partners provide to us (Fig. 4, Fig. 5). This allows for greater flexibility, as we can base our decision making not only on the larger biological scope, but on local cultural will and political feasibility as well. Ultimately, these tools will help the RWBJV, and our partner organizations, identify which properties should be targeted for grassland restoration (e.g., Conservation Reserve Program) or grassland enhancement/management (e.g., Environmental Quality Incentives Program [EQIP], Landowner Agreements) where conservation dollars can be spent most efficiently.
